
Evaluation procedure
Each track will be evaluated independently, and it will have a separate leaderboard and set of prizes.
In order to be eligible for the official ranking, any submission must be described in a corresponding detailed technical report with associated reproducible code and models so that they can be locally verified (see Technical Report). This is used to prevent possible cheating using extra data, hand-crafted solutions, etc...
The competition will run in a two-phase offline-format. In the first phase, training and development data are released, which the participants use to develop models. In the second phase, participants apply their models to the heldout evaluation sets. Final rankings are decided by position on the evaluation-set leaderboard.
Unlike Shifts 1.0, participants will be isolated from the evaluation data to ensure the data protection and patient privacy of the evaluation data used for the medical task.
Leaderboard construction
A key desiderata is that the models' uncertainty estimates correlate with the degree of shift and therefore the error which the models make. Robustness and uncertainty quality is thus jointly assessed via the area under the retention curve as explained below (see Error Retention Curves). For both competition tracks error retention curves will be constructed on the public development and heldout evaluation datasets. The participant with the lowest area under the error retention curve (R-AUC) on the evaluation sets will be considered the winners. ** **
**Error Retention Curves **
Error retention curves will be used as the main evaluation criterion. Each track will use error retention curves of task-specific measures, which are further described in dedicated sections below.
We assume that as the degree of distributional shift increases, so should a model’s errors; in other words, a model’s uncertainty estimates should be correlated with the degree of its error. This informs our choice of assessment metrics, which must jointly assess robustness and uncertainty estimation.
Error-retention curves (see Figure below) plot a model’s mean error over a dataset, as measured using a metric such as error-rate, MSE, nDSC, etc., with respect to the fraction of the dataset for which the model’s predictions are used. These retention curves are traced by replacing a model’s predictions with ground-truth labels obtained from an oracle in order of decreasing uncertainty, thereby decreasing error.
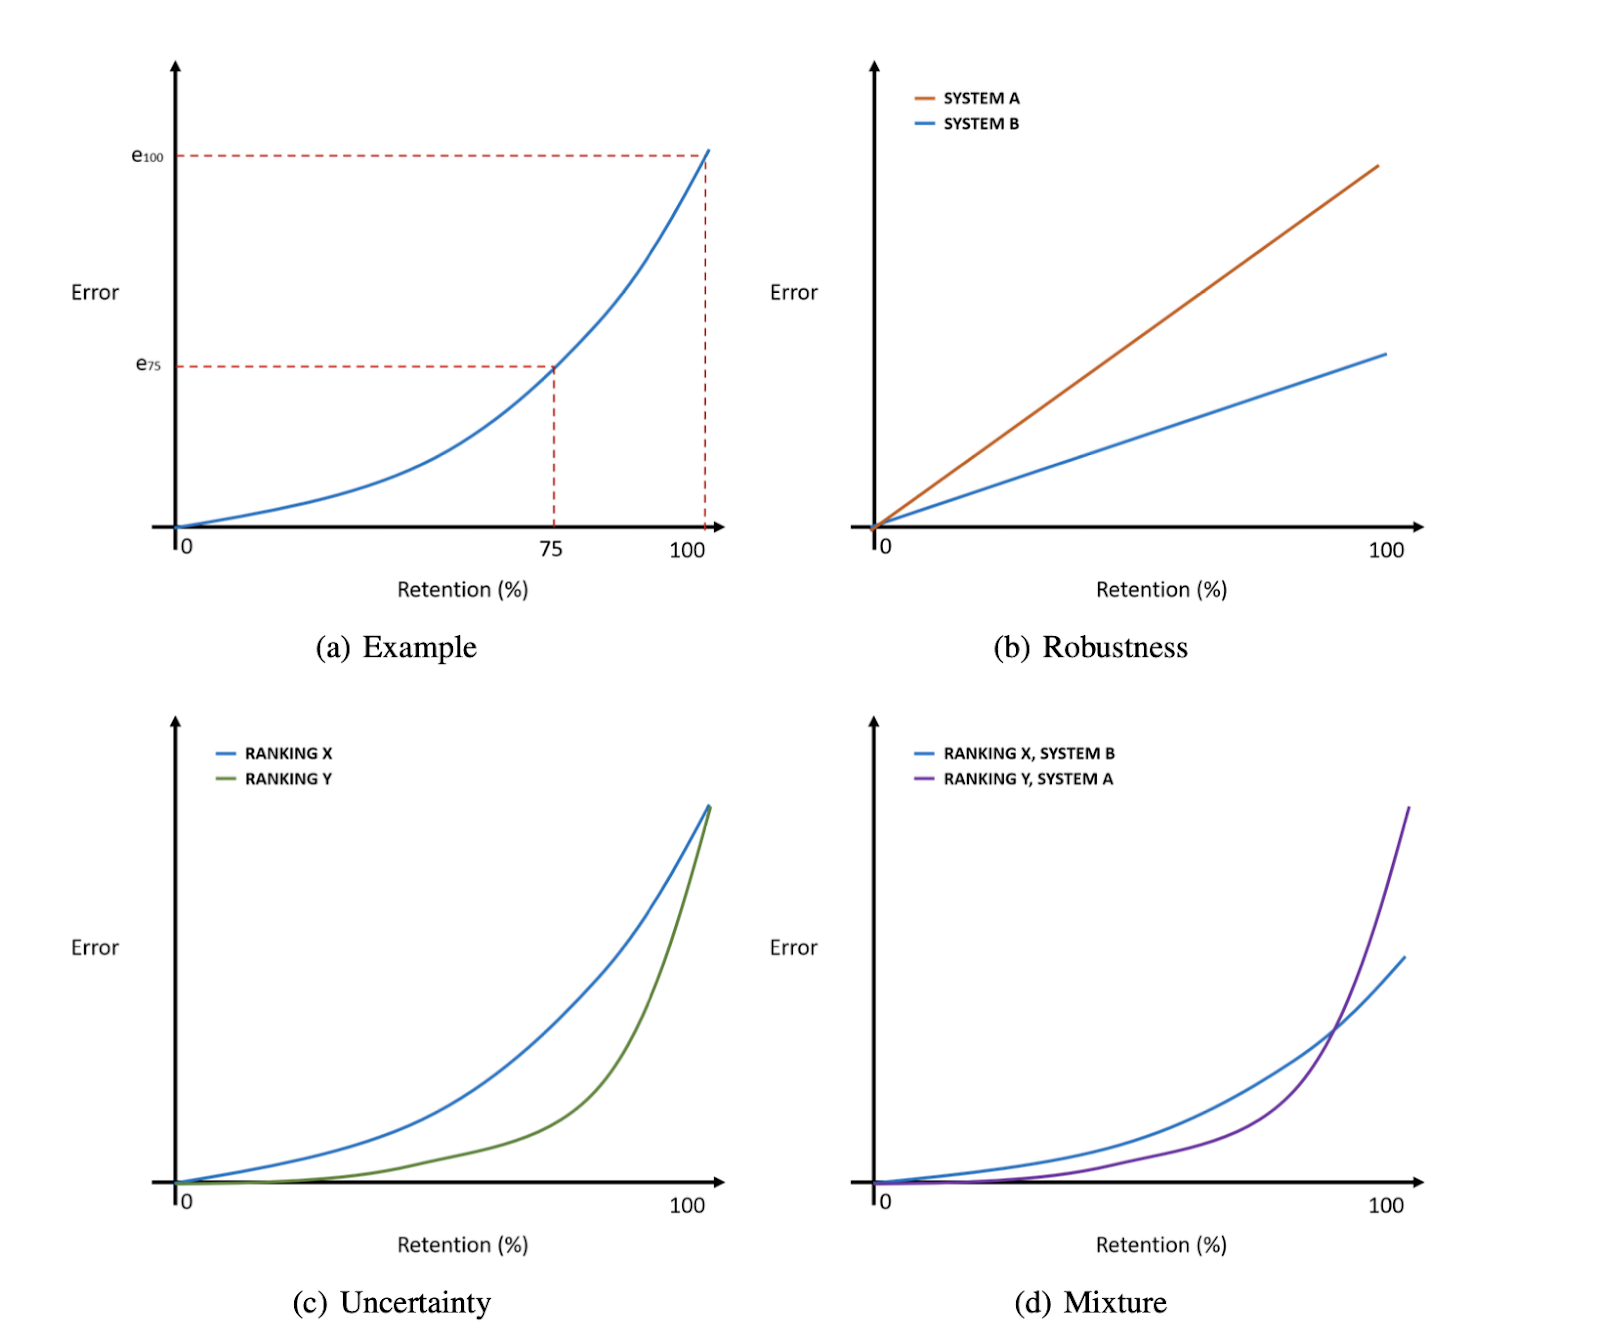
Fig. Schematic explanation of error retention curves. Example: e100 is the performance of the system using all the data while e75 is the error of the system using the top 75% of the data with the rejected data set to the ground-truth. Robustness: two systems are compared with random ranking of data where system B is more robust than system A (lower error). Uncertainty: For the same system, two different uncertainty approaches are consider where the uncertainty measure Y produces a better ranking. Mixture: despite having worse robustness, system A here has a better uncertainty ranking measure.
The Area under the retention curve (R-AUC) is used for jointly assessing robustness to distributional shift and the quality of the uncertainty estimates. R-AUC can be reduced either by improving the predictions of the model, such that it has lower overall error at any given retention rate, or by providing estimates of uncertainty which better correlate with error, such that the most incorrect predictions are rejected first.
Track 1 Specific Measures
MS lesion segmentation of 3D MRI images is typically assessed via the Dice Similarity Coefficient (DSC) [Dice, 1945; Sorensen et al., 1948] between manual lesion annotations and the model's prediction. However, DSC is strongly correlated with lesion load - patients with higher lesion load (volume occupied by lesion) will have a higher DSC [Reinke et al., 2021].
We will evaluate instead:
-
The lesion segmentation by the normalized Dice Similarity Coefficient (nDSC). This version, compared to the original [Dice, 1945; Sorensen et al., 1948], corrects for the systematic bias between manual lesion annotations and the model's prediction. More info about nDSC.
-
The Error-retention curves in this case are computed on the foreground voxels to assess the quality of the uncertainty estimation as the area between the curve and a horizontal line at 1 that corresponds to high nDSC. Positions on the leaderboard will be determined by the area under an Error Retention Curve (R-AUC) constructed using 100 - nDSC as the 'error metric'. More info about the error-retention curves is given in the paragraph above (Error Retention Curves) and in this paper .
Track 2 Specific Measures
Predictive performance is assessed using the standard metrics: Root Mean Square Error (RMSE), Mean Absolute Error (MAE) and Mean Absolute Percentage Error (MAPE). Area under Mean Square error (MSE) and F1 retention curves [Malinin, 2019, Malinin et al., 2021] is used to assess jointly the robustness to distributional shift and uncertainty quality. The respective performance metrics are named R-AUC and F1-AUC. Following the methodology proposed by Malinin et al., 2021, we use the MSE as the error metric and for F1 scores we consider acceptable predictions those with MSE\<(500kW)^2. As the uncertainty measure, we use the total variance (i.e. the sum of data and knowledge uncertainty [Malinin, 2019]). A good model should have a small R-AUC and large F1-AUC. Area under the MSE error retention curves (R-AUC) will be used to determine leaderboard positions.
References
[Malinin et al., 2021] Andrey Malinin, Neil Band, Yarin Gal, Mark Gales, Alexander Ganshin, German Chesnokov, Alexey Noskov, Andrey Ploskonosov, Liudmila Prokhorenkova, Ivan Provilkov, Vatsal Raina, Vyas Raina, Denis Roginskiy, Mariya Shmatova, Panagiotis Tigas, and Boris Yangel, “Shifts: A dataset of real distributional shift across multiple large-scale tasks,” in Thirty-fifth Conference on Neural Information Processing Systems Datasets and Benchmarks Track (Round 2), 2021.
[Malinin, 2019] Andrey Malinin, Uncertainty Estimation in Deep Learning with application to Spoken Language Assessment, Ph.D. thesis, University of Cambridge, 2019.